Cash Flow
Consolidated Cash Flow

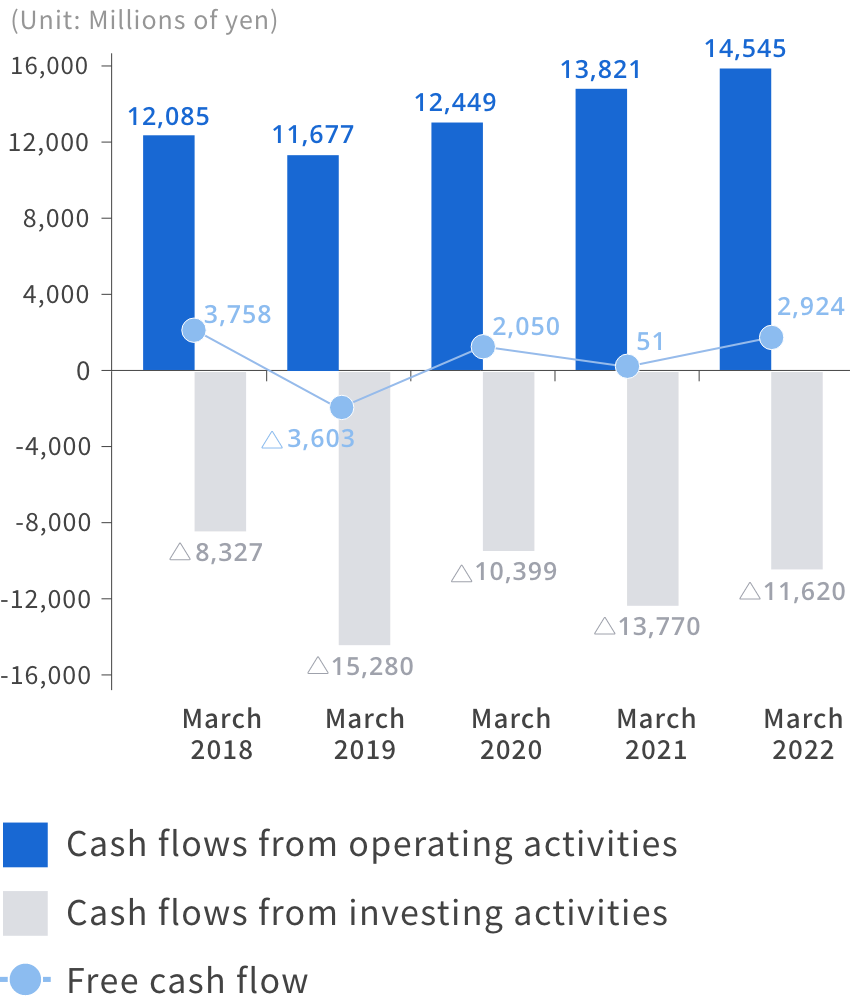
(Unit: Millions of yen)
| Category | As of March 31, 2020 | As of March 31, 2021 | As of March 31, 2022 | As of March 31, 2023 | As of March 31, 2024 |
|---|---|---|---|---|---|
| Cash flows from operating activities | 12,449 | 13,821 | 14,545 | 15,590 | 5,729 |
| Cash flows from investing activities | -10,399 | -13,770 | -11,620 | -4,863 | -9,594 |
| Free cash flow* | 2,050 | 51 | 2,924 | 10,726 | -3,865 |
| Cash flows from financing activities | -1,161 | 1,722 | -4,802 | -10,441 | 6,694 |
| Effect of exchange rate change on cash and cash equivalents | -225 | 278 | 523 | 301 | 873 |
| Net increase (decrease) in cash and cash equivalents | 664 | 2,053 | -1,355 | 586 | 3,702 |
| Cash and cash equivalents at beginning of period | 16,536 | 17,200 | 19,253 | 17,898 | 18,484 |
| Cash and cash equivalents at end of period | 17,200 | 19,253 | 17,898 | 18,484 | 22,187 |
- *Free cash flow = Cash flows from operating activities + Cash flows from investing activities
